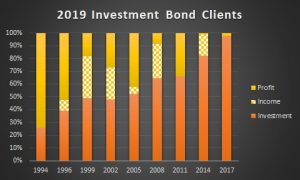
The columns show the ratio of profit to lump sum investment for nine different clients. Client one invested in 1994, two in 1996, three in 1999, four in 2002, five in 2005, six in 2008, seven in 2011, eight in 2014 and client nine in 2017. Performance relates to one particular fund managed by one major UK investment provider.
Brown shows amount invested. Yellow shows accrued profit in 2019 (after costs, charges & basic rate tax) and chequered yellow and white shows “withdrawals,” which may be viewed as profit already taken.
Disclaimer: This post is intended for existing clients only to show how one specific investment performed in the past. Figures used to compile the graph are taken from real clients’ annual investment statements. As a result, total profit may include yields from dates other than the starting year if clients added to their bond. You should not consider this post as “advice” to go and buy an investment bond or any other investment. Although this particular bond / fund has done well, other bonds have made a loss. We cannot say for certain this bond will perform as well in the future as it has in the past. The word “bond” has a number of different meanings. I recommend anyone who is unsure of the risks, tax consequences or nature of any financial product should seek proper regulated financial advice before getting involved.